
Bitcoin has traditionally adhered to a known four-year cycle. As we are halfway through the current cycle, market players are keenly observing trends and market signals to forecast the upcoming years. This piece explores the structure of Bitcoin’s quadrennial cycle, its historical market performance, and potential future scenarios.
The Quadrennial Cycle
Bitcoin’s quadrennial cycle is partially influenced by the pre-planned halving events, which lower the miners’ block reward by 50% every four years. This halving results in a decrease in new Bitcoin supply in the market, often leading to supply-demand imbalances that could drive prices up.
This can be easily illustrated by the Stock-to-Flow Model, which contrasts the existing BTC in circulation with its inflation rate, and projects a ‘fair-value’ based on similar hard assets like Gold and Silver.
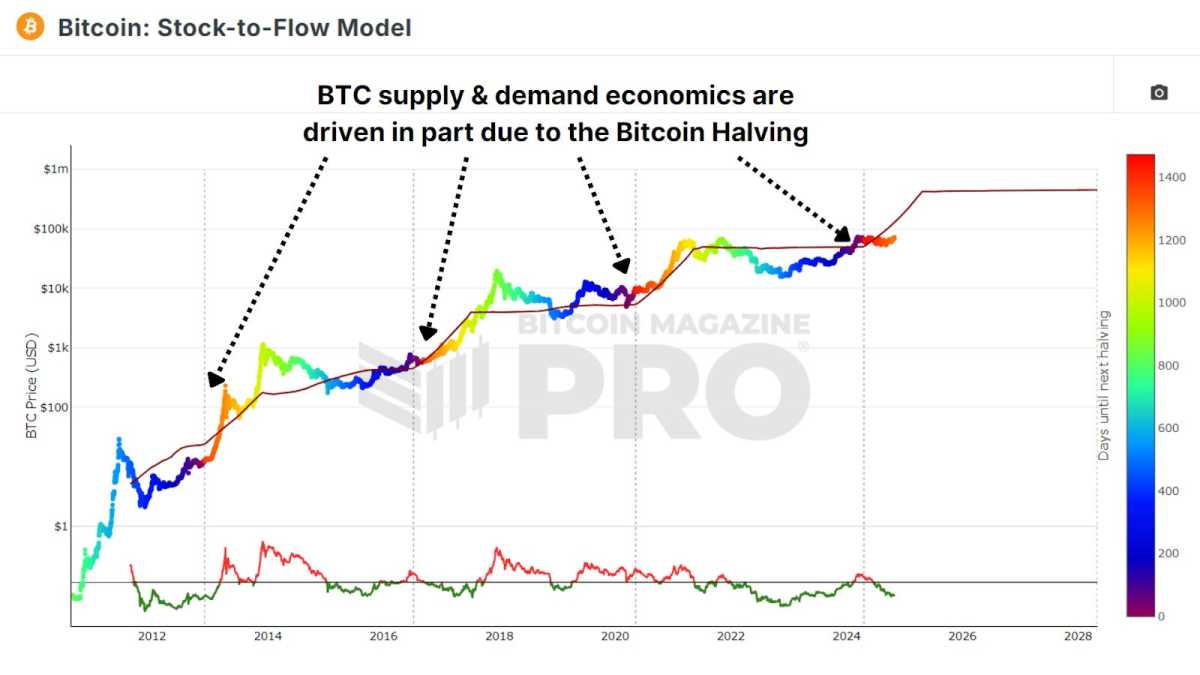
At present, we’re halfway through the cycle, indicating that we may be entering a phase of explosive gains as the typical one-year catch-up phase post-halving advances.
Retrospective View of 2022
Two years back, Bitcoin underwent a severe downfall amid a series of corporate collapses. November 2022 marked the decline of FTX, as insolvency rumors sparked massive sell-offs. This had a domino effect, causing other crypto institutions like BlockFi, 3AC, Celsius, and Voyager Digital, to collapse as well.
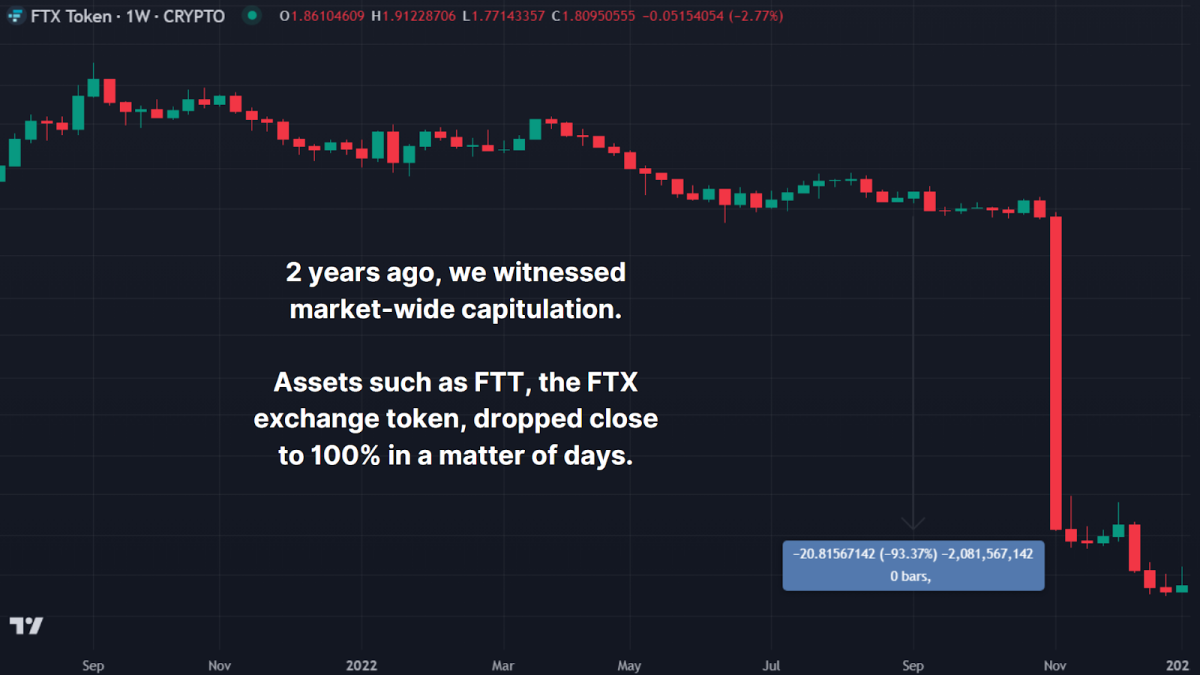
Bitcoin’s value fell from around $20,000 to $15,000, echoing the wider market panic and leaving investors concerned about Bitcoin’s future. However, staying true to its form, Bitcoin bounced back again, recovering fivefold from its 2022 lows. Investors who braved the storm reaped rewards, and this bounce-back strengthens the argument that Bitcoin’s cyclical nature is still intact.
Mirroring Sentiments
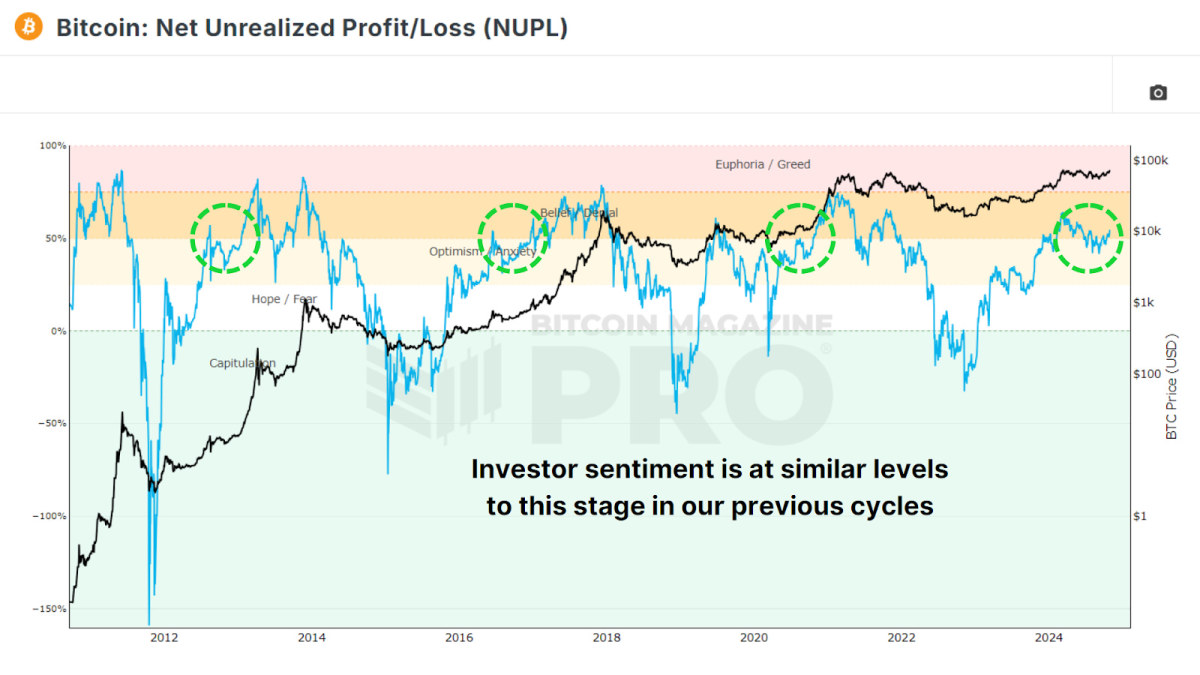
Besides price trends, investor sentiment also traces a predictable pattern throughout each cycle. Analysis of the Net Unrealized Profit and Loss (NUPL), a metric indicating unrealized market gains and losses, suggests that emotions like euphoria, fear, and surrender reoccur consistently. Bitcoin investors typically experience intense fear or pessimism during every bear market, only to shift back to optimism and euphoria as prices rebound and go up. Currently, we’re once again transitioning into the ‘Belief’ phase following our early cycle surge and subsequent consolidation.
The Global Cash Cycle
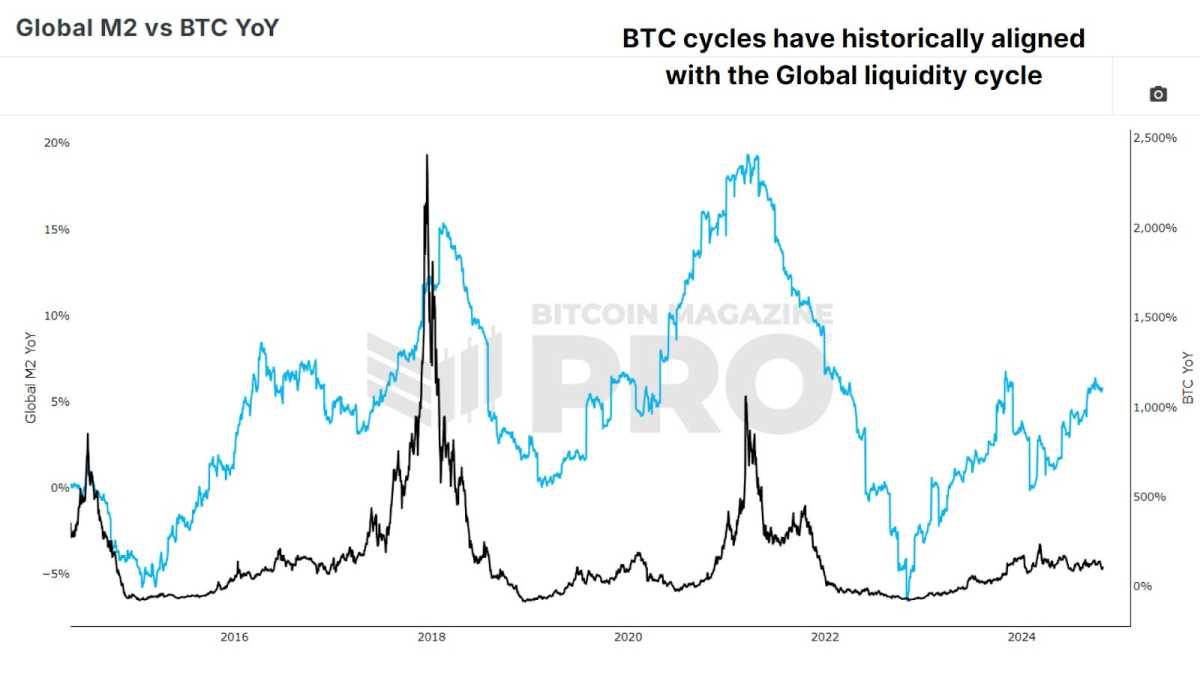
Global money supply and cyclical liquidity, as represented by Global M2 YoY vs BTC, has also traced a four-year cycle. For example, M2 liquidity hit rock bottom in 2015 and 2018, just when Bitcoin reached its lows. In 2022, M2 again touched a trough, perfectly synchronizing with Bitcoin’s bear market trough. Following these periods of economic squeeze, we notice fiscal growth across central banks and governments worldwide, which leads to better conditions for Bitcoin price appreciation.
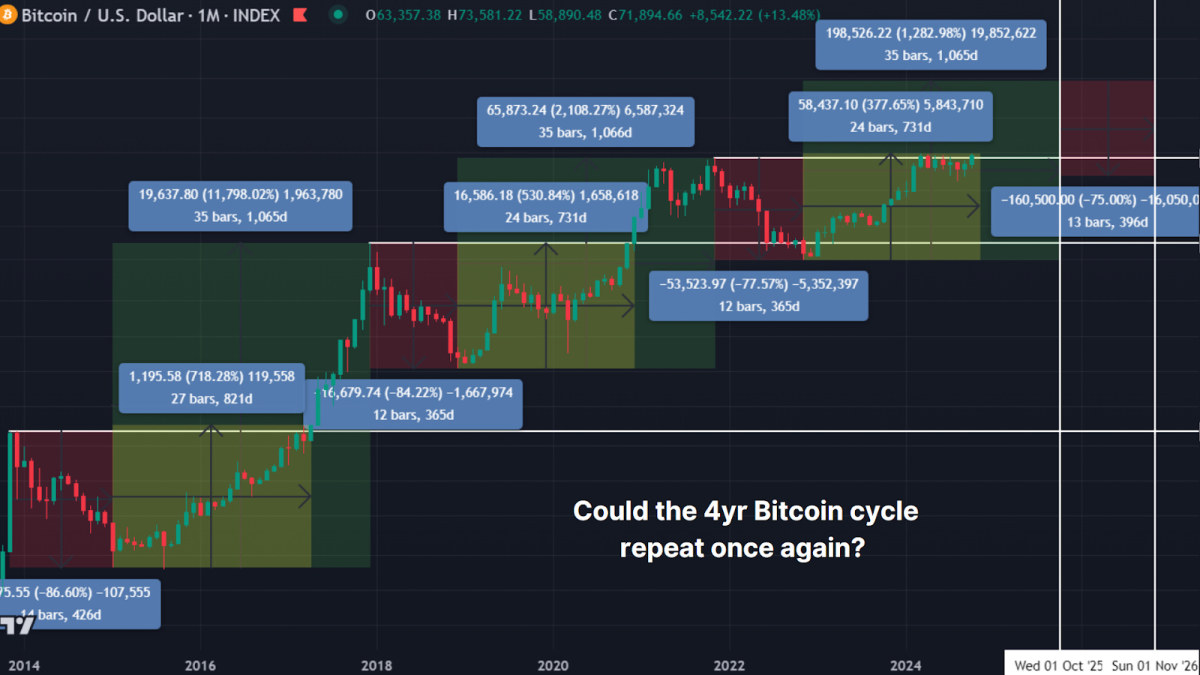
Repeating Patterns
Historical price analysis suggests that Bitcoin’s current path closely resembles previous cycles. From its lows, Bitcoin typically takes around 24-26 months to surpass previous highs. In the last cycle, it took 26 months; in the current cycle, Bitcoin’s price is following a similar upward trajectory after 24 months. Bitcoin has traditionally peaked about 35 months after its lows. If this pattern continues, we may witness significant price increases through October 2025, after which another bear market may begin.
After the anticipated peak, history suggests Bitcoin would enter a bear phase in 2026, lasting approximately one year until the next cycle commences. While these patterns aren’t guaranteed, they provide a roadmap that Bitcoin has followed in previous cycles. They offer a potential framework for investors to predict and adapt to the market.
Conclusion
Despite obstacles, Bitcoin’s four-year cycle has persevered, majorly due to its supply schedule, global liquidity, and investor psychology. Therefore, the four-year cycle remains a valuable tool for investors to interpret potential price movements in Bitcoin and our base case for the rest of this cycle. However, relying solely on this cycle could be myopic. By incorporating on-chain metrics, liquidity analysis, and real-time investor sentiment, data-driven approaches can assist investors to respond effectively to changing conditions.
For a more detailed exploration of this topic, check out a recent YouTube video here: The 4 Year Bitcoin Cycle – Half Way Done?


